Introduction:
This document explains how to deploy Prometheus and Grafana on a Kubernetes cluster manually, without using Helm or other automation tools.
-
- Prometheus collects metrics (like CPU usage, memory usage, and pod status) from your applications and Kubernetes components.
-
- Grafana visualizes these metrics on dashboards, making it easy to monitor your cluster in real time.
you will learn how to:
-
- Create a namespace to organize monitoring components.
-
- Deploy Prometheus with a ConfigMap, Deployment, and Service.
-
- Deploy Grafana, connect it to Prometheus, and access the UI.
-
- Deploy a sample NGINX application and monitor its metrics.
-
- Verify that metrics are collected and visualize them on Grafana dashboards.
Prerequisites:
Create a section for what must be ready before starting:
-
- Kubernetes cluster (master + worker nodes)
-
- kubectl installed & configured
-
- NGINX or another pod to monitor
-
- Internet connection to pull Docker images
-
- Optional: jq installed for JSON processing
What is Prometheus?
-
- Prometheus is a monitoring system.
-
- It collects metrics from Kubernetes components and applications.
-
- Metrics include CPU, memory, network, pod health, etc.
-
- Prometheus stores this data and provides APIs for querying.
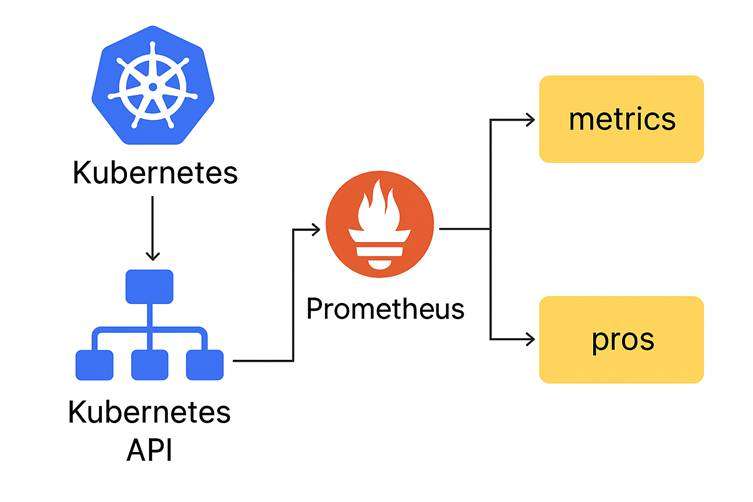
Kubernetes → Prometheus → Metrics + Alerts
-
- Kubernetes produces metrics
-
- Prometheus collects and stores them
-
- Prometheus sends data to dashboards
-
- Prometheus triggers alerts when necessary
What is Grafana?
-
- Grafana is a visualization tool.
-
- It shows Prometheus data in charts, graphs, dashboards.
-
- Helps you understand cluster performance, pod behavior, and scaling
Why Do We Need Monitoring in Kubernetes?
-
- Kubernetes is dynamic → pods are created/destroyed frequently.
-
- Applications may autoscale (HPA).
-
- You need metrics to know what is happening inside the cluster.
-
- Prometheus tracks metrics, Grafana visualizes them
What is a Service in Kubernetes?
-
- A service gives stable access to pods.
-
- Even if pods die or change IPs, service stays same.
-
- Grafana service exposes port 3000 inside cluster.
-
- Prometheus service exposes port 9090.
What is HPA (Horizontal Pod Autoscaler)?
The Horizontal Pod Autoscaler (HPA) is a Kubernetes feature that automatically increases or decreases the number of pods in a Deployment based on real-time workload.
How HPA Uses Prometheus Metric?
HPA (Horizontal Pod Autoscaler) can automatically increase or decrease the number of pods in your Kubernetes Deployment.
To make the correct scaling decision, HPA needs metrics such as:
-
- CPU usage
-
- Memory usage
-
- Custom application metrics (request count, latency, errors, etc.)
Prometheus plays a major role when custom metrics are used
Create namespace:
Command:
kubectl create namespace monitoringExplanation:
-
- kubectl → Kubernetes command-line tool
-
- create → We are creating a new resource
-
- namespace → Type of resource
-
- monitoring → Name of the new namespace
-
- This creates a separate area in Kubernetes to keep Prometheus & Grafana organized
Expected Output:

Create Prometheus ConfigMap:
1.Command:
nano prometheus-config.yamlPaste this,
apiVersion: v1
kind: ConfigMap
metadata:
  name: prometheus-config
  namespace: monitoring
  labels:
  name: prometheus-config
data:
  prometheus.yml: |
    global:
      scrape_interval: 15s
    scrape_configs:
      # Scrape Prometheus itself
  - job_name: 'prometheus'
    static_configs:
      - targets: ['localhost:9090']

  # Scrape all Kubernetes pods with annotation
  - job_name: 'kubernetes-pods'
  kubernetes_sd_configs:
    - role: pod
  relabel_configs:
    - source_labels:
 [__meta_kubernetes_pod_annotation_prometheus_io_scrape]
             action: keep
             regex: true
           - source_labels:
 [__meta_kubernetes_pod_annotation_prometheus_io_path]
             action: replace
             target_label: __metrics_path__
             regex: (.*)
           - source_labels: [__address__, __meta_kubernetes_pod_annotation_prometheus_io_port]
             action: replace
             target_label: __address__
             regex: (.*):(\d+)
             replacement: $1:$2
Explanation:
-
- nano = a text editor inside Linux.
-
- This command opens a new empty file called prometheus-config.yaml.
-
- You paste your Prometheus ConfigMap YAML inside this file.
Why we run it
To create Prometheus configuration (prometheus.yml) using a ConfigMap.
Expected Output:

2.Command:
kubectl apply -f prometheus-config.yamlExplanation:
-
- apply → Create/update something using a YAML file
-
- -f → “from file”
-
- prometheus-config.yaml → This file contains the configuration
-
- Kubernetes will:
-
- create a ConfigMap
-
- store prometheus.yml inside it
-
- Prometheus uses this config to scrape metrics
-
- Kubernetes will:
Expected Output:

Create Prometheus Deployment:
1.Command:
nano prometheus-deployment.yamlPaste this,
apiVersion: apps/v1
kind: Deployment
metadata:
   name: prometheus-deployment
   namespace: monitoring
   labels:
     app: prometheus
spec:
  replicas: 1
  selector:
    matchLabels:
      app: prometheus
  template:
    metadata:
      labels:
        app: prometheus
    spec:
      containers:
      - name: prometheus
        image: prom/prometheus:v2.52.0
        args:
          - "--
   config.file=/etc/prometheus/prometheus.yml"
              - "--storage.tsdb.path=/prometheus/"
            ports:
              - containerPort: 9090
            volumeMounts:
              - name: prometheus-config-volume
                mountPath: /etc/prometheus/
          volumes:
            - name: prometheus-config-volume
              configMap:
                name: prometheus-config
Explanation:
-
- Opens a new file named prometheus-deployment.yaml.
-
- You paste the Prometheus Deployment YAML, which controls:
-
- Prometheus container image
-
- ports
-
- volume mounts
-
- replicas
-
- You paste the Prometheus Deployment YAML, which controls:
Why we run it
To create the Kubernetes Deployment that runs Prometheus.
Expected Output:

2.Command:
kubectl apply -f prometheus-deployment.yamlExplanation:
-
- Creates the Deployment for Prometheus
-
- Runs the prom/prometheus container
-
- Mounts the ConfigMap into the container
-
- Starts Prometheus on port 9090
-
- Ensures 1 replica is always running
Expected Output:

Expose Prometheus:
1.Command:
nano prometheus-service.yamlPaste this,
apiVersion: v1
kind: Service
metadata:
  name: prometheus-service
  namespace: monitoring
  labels:
    app: prometheus
spec:
  type: NodePort
  ports:
    - port: 9090
      targetPort: 9090
      nodePort: 30090
  selector:
    app: prometheus
Explanation:
-
- Opens a file to create the Service manifest for Prometheus.
-
- This defines how Prometheus is exposed (NodePort 30090).
Why
Without a Service → you cannot access Prometheus UI.
Expected Output:

2.Command:
kubectl apply -f prometheus-service.yamlExplanation:
-
- Creates a Service
-
- Type = NodePort → accessible from outside (browser)
-
- Exposes:
-
- Cluster port 9090
-
- NodePort 30090
-
- Exposes:
-
- Lets you open Prometheus UI using localhost:30090
Expected Output:

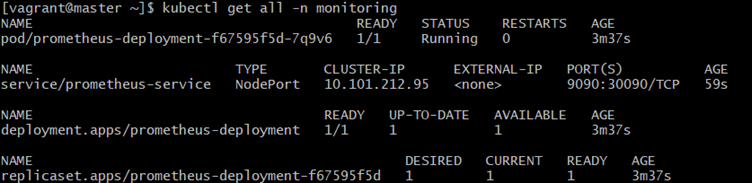
Verify Prometheus:
Command:
kubectl get all -n monitoringExplanation:
-
- get all → lists all objects
-
- -n monitoring → inside the monitoring namespace
-
- Helps confirm:
-
- pods running
-
- services created
-
- deployments working
-
- Helps confirm:
Expected Output:
Port-forward Prometheus:
1.Command:
kubectl port-forward svc/prometheus-service -n monitoring 9090:9090Explanation:
-
port-forward→ exposes internal Kubernetes service locally
-
svc/prometheus-service→ forwarding the Prometheus service
-
9090:9090→
-
- left = your laptop
-
- right = container
Expected Output:

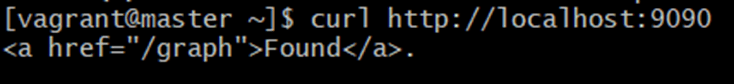
2.Command:
curl http://localhost:9090Explanation:
-
- curl calls a webpage from the Linux terminal.
-
- This checks if Prometheus is running on port 9090.
Meaning
If Prometheus works, you will get some HTML output.
Expected Output:
Grafana: create datasource ConfigMap:
1.Command:
nano grafana-datasource.yamlPaste this,
apiVersion: v1
kind: ConfigMap
metadata:
  name: grafana-datasource
  namespace: monitoring
data:
  datasource.yml: |
    apiVersion: 1
    datasources:
      - name: Prometheus
        type: prometheus
        access: proxy
        url: http://prometheus-service.monitoring.svc.cluster.local:9090
        isDefault: true
Explanation:
-
- Opens a new YAML file to configure Grafana’s data source.
-
- This connects Grafana → Prometheus inside Kubernetes.
Why
Grafana needs Prometheus to fetch metrics.
Expected Output:

2.Command:
kubectl apply -f grafana-datasource.yamlExplanation:
-
- Creates a ConfigMap
-
- Pre-configures Grafana to connect to Prometheus
-
- No need to manually add data source later
Expected Output:

Create Grafana Deployment:
1.Command:
nano grafana-deployment.yamlPaste this,
apiVersion: apps/v1
kind: Deployment
metadata:
  name: grafana
  namespace: monitoring
  labels:
    app: grafana
spec:
  replicas: 1
  selector:
    matchLabels:
      app: grafana
  template:
    metadata:
      labels:
        app: grafana
    spec:
      containers:
        - name: grafana
          image: grafana/grafana:10.2.0
          ports:
            - containerPort: 3000
          env:
           - name: GF_SECURITY_ADMIN_USER
             value: admin
           - name: GF_SECURITY_ADMIN_PASSWORD
             value: admin123
      volumeMounts:
        - name: grafana-storage
          mountPath: /var/lib/grafana
        - name: grafana-datasource
          mountPath: /etc/grafana/provisioning/datasources/
     volumes:
       - name: grafana-storage
         emptyDir: {}
       - name: grafana-datasource
         configMap:
           name: grafana-datasource
Explanation:
-
- Opens the Deployment file for Grafana.
-
- You paste the YAML to run Grafana container:
-
- container image
-
- admin password
-
- datasource configuration
-
- You paste the YAML to run Grafana container:
Why
This command creates the Grafana workload inside Kubernetes.
Expected Output:

2.Command:
kubectl apply -f grafana-deployment.yamlExplanation:
-
- Creates Deployment for Grafana
-
- Runs container on port 3000
-
- Sets admin/admin123 as login
-
- Automatically loads the datasource ConfigMap
-
- Creates storage (emptyDir)
Expected Output:

Create Grafana Service:
1.Command:
nano grafana-service.yamlPaste this,
apiVersion: v1
kind: Service
metadata:
  name: grafana
  namespace: monitoring
  labels:
    app: grafana
spec:
  type: NodePort
  ports:
   - port: 3000
     targetPort: 3000
     nodePort: 30300
  selector:
    app: grafana
Explanation:
-
- Creates the Service file for Grafana.
-
- Exposes UI using NodePort 30300.
Expected Output:

2.Command:
kubectl apply -f grafana-service.yamlExplanation:
-
- Creates NodePort service
-
- Exposes Grafana UI on:
-
- Cluster port 3000
-
- NodePort 30300
-
- Exposes Grafana UI on:
Expected Output:

Apply All Grafana Resources:
1.Command:
kubectl create deployment nginx --image=nginx -n monitoringExplanation:
-
- Creates a Deployment named nginx
-
- Runs official nginx image
-
- Starts a web server pod
Expected Output:

2.Command:
kubectl expose deployment nginx --port=80 -n monitoringExplanation:
-
- Exposes nginx as a Service
-
- Makes port 80 accessible inside the cluster
Expected Output:

3.Command:
kubectl annotate pod -l app=nginx prometheus.io/scrape="true" prometheus.io/port="80" -n monitoringExplanation:
-
- annotate → add metadata
-
- -l app=nginx → select nginx pods
-
- prometheus.io/scrape=”true” → tells Prometheus to scrape this pod
-
- prometheus.io/port=”80″ → metrics port
Prometheus will now automatically collect metrics from NGINX.
Expected Output:

Access Grafana:
Port-Forward Command:
Run on Master Node Terminal (ssh into master):
kubectl port-forward svc/grafana -n monitoring 3000:3000Explanation:
-
- Opens Grafana UI locally
-
- This command creates a tunnel from your local machine to the Grafana pod.
-
- localhost:3000 on your laptop will now connect to Grafana inside Kubernetes.
Expected Output:

Verify Scraping:
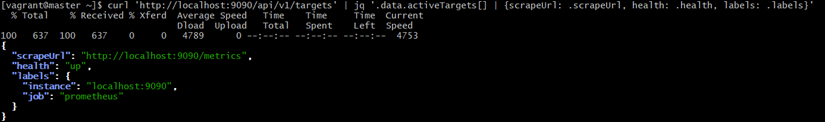
Command:
curl 'http://localhost:9090/api/v1/targets' | jq '.data.activeTargets[] | {scrapeUrl: .scrapeUrl, health: .health, labels: .labels}'Explanation:
-
- Calls Prometheus API endpoint /api/v1/targets
-
- Gets all the metrics targets Prometheus is scraping
-
- jq formats the output and shows:
-
- scrapeUrl
-
- health
-
- target labels
Why
This is used to check:
✔ Is Prometheus scraping Nginx?
✔ Is Prometheus scraping Kubernetes Pods?
✔ Is Prometheus healthy?
Expected Output:
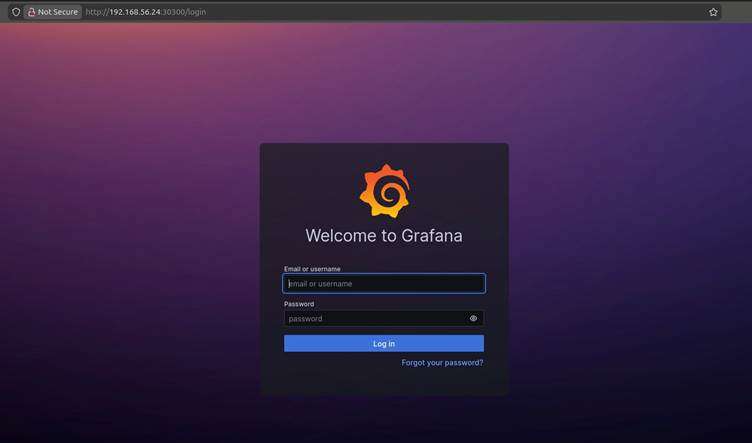
Open Grafana UI:
In your Windows browser:
http://localhost:3000
Explanation:
This is Grafana UI URL.
You open this in browser after running:
kubectl port-forward svc/grafana -n monitoring 3000:3000Login
-
- username: admin
-
- password: admin123
Expected Output:
conclusion
Deploying Prometheus and Grafana on Kubernetes is an essential step toward building a reliable, observable, and production-ready cluster. In this guide, we deployed both tools manually—ConfigMaps, Deployments, and Services—so you understand exactly how monitoring works behind the scenes without relying on Helm or automation tools.
By the end of this setup:
-
- Prometheus continuously collects metrics from your Kubernetes components, pods, and applications.
-
- Grafana transforms those metrics into powerful dashboards that provide real-time visibility into cluster performance.
-
- NGINX was deployed as a sample application, and we confirmed that Prometheus successfully scraped its metrics.
-
- You accessed Grafana and verified the data flow end-to-end—from Kubernetes → Prometheus → Grafana.
for more information about kubernetes you can refer to jeevi’s page