
DevOps teams make decisions constantly:
Should we deploy now or wait?
Is this incident rate “normal”?
Did performance actually improve or did we just get lucky?
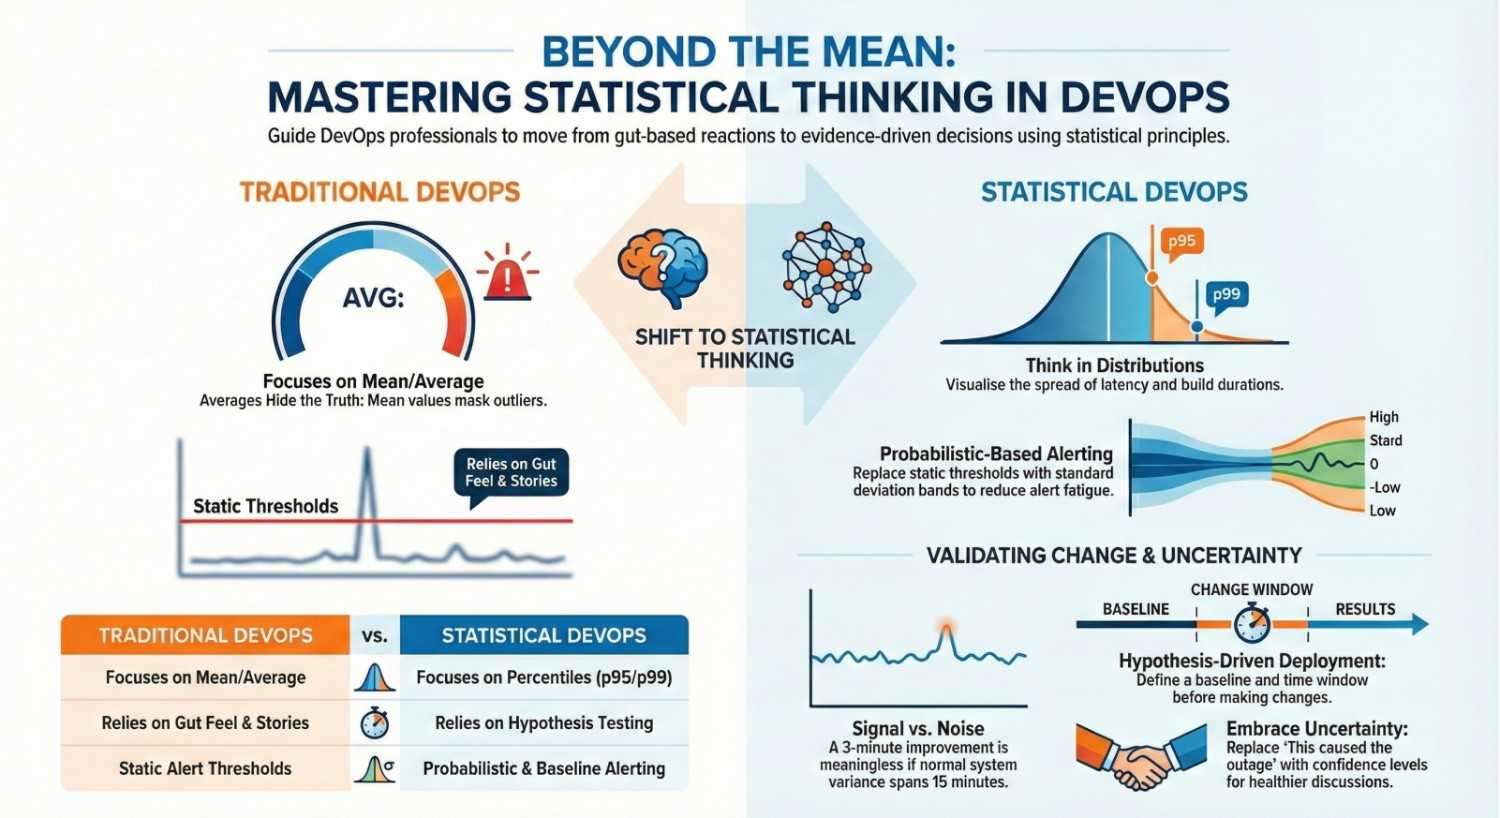
Most of the time, these decisions are made using dashboards, instincts, and war stories. Statistics rarely shows up explicitly, but when it doesn’t, teams quietly fall into predictable traps.
Statistical thinking doesn’t mean turning DevOps engineers into data scientists. It means thinking in distributions, uncertainty, and evidence instead of single numbers and gut feel.
Let’s break down how statistical thinking improves DevOps decision-making and where it changes outcomes the most.
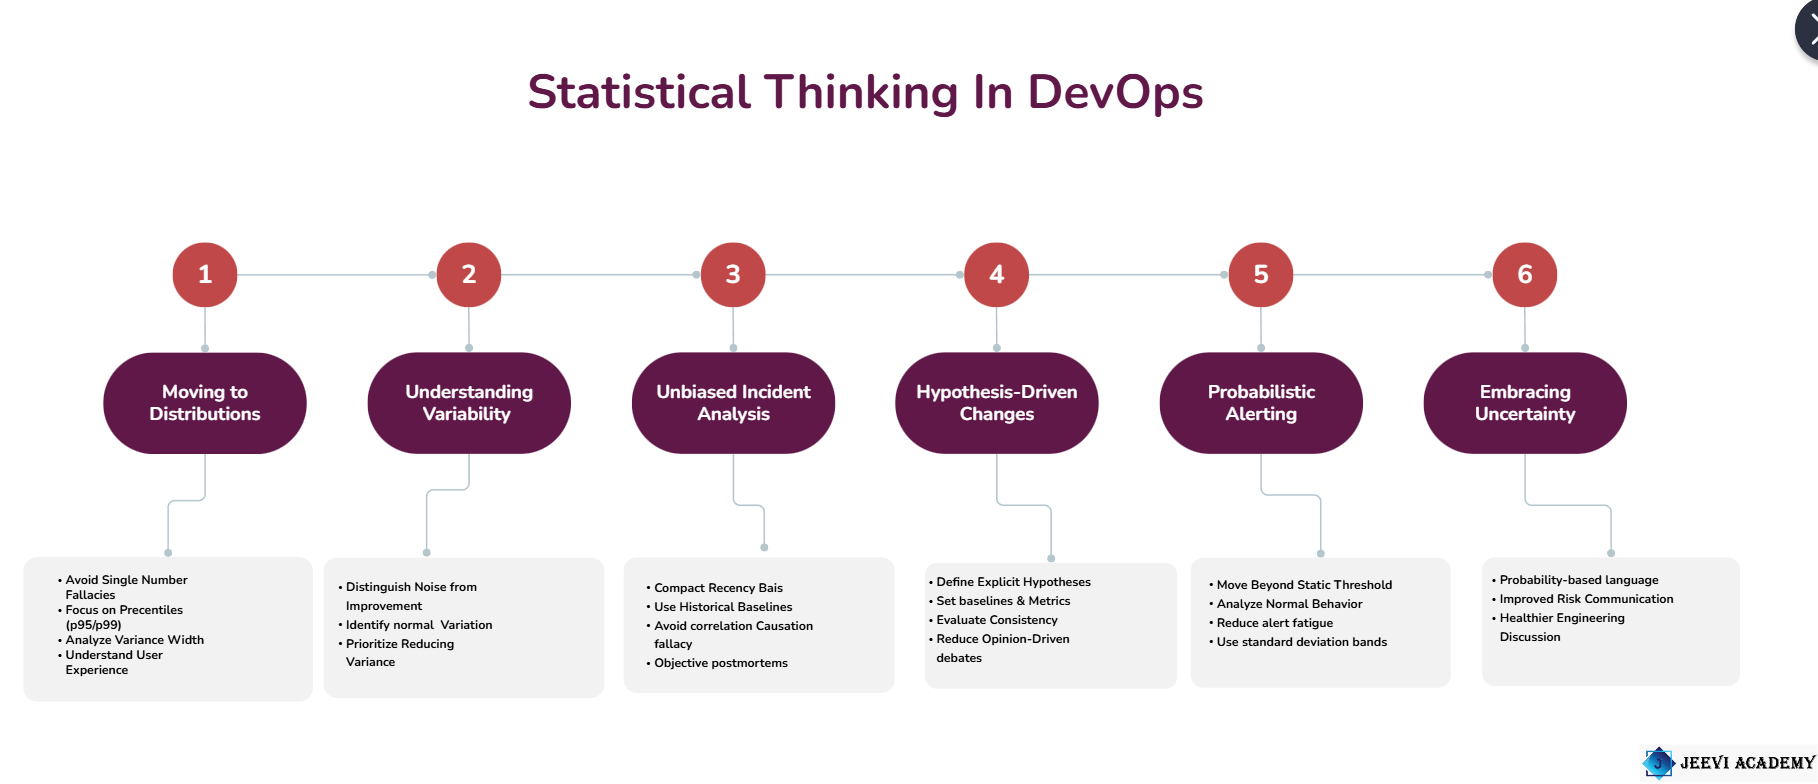
1. Moving From Single Numbers to Distributions
DevOps dashboards love single values:
- Average latency
- Mean deployment time
- MTTR last month
The problem? Averages lie.
Latency, recovery time, and build duration are almost always skewed distributions, not neat bell curves. A single slow deployment or a rare outage can distort the mean.
Statistical mindset shift
Instead of asking:
“What is our average latency?”
Ask:
- What does the distribution look like?
- What happens at the 95th or 99th percentile?
- How wide is the variance?
DevOps impact
- Better SLO definitions
- Fewer surprises during traffic spikes
- More honest performance reporting
Percentiles and distributions tell you how users actually experience your system, not how it behaves “on average.”
2. Understanding Variability Is More Important Than Improvement
Teams often celebrate improvements like:
“Deployment time went from 12 minutes to 9 minutes!”
But statistically, that improvement might be meaningless.
If deployment times normally vary between 5 and 20 minutes, a 3-minute change could just be noise.
Statistical mindset shift
Instead of focusing only on improvement, ask:
- Is the change outside normal variation?
- Did variability decrease?
- Is this statistically distinguishable from random fluctuation?
DevOps impact
- Fewer false victories
- Better prioritization of real improvements
- Less time wasted chasing noise
Reducing variance is often more valuable than reducing the mean.
3. Making Incident Analysis Less Biased
After incidents, humans are fantastic at finding patterns even when none exist.
Common postmortem traps:
- Over-weighting the most recent incident
- Assuming correlation implies causation
- Fixating on the most visible failure
Statistical mindset shift
Statistical thinking encourages:
- Looking at incident frequency over time
- Comparing against historical baselines
- Asking whether this incident rate is actually abnormal
For example:
- Is this spike outside expected variance?
- Are incidents increasing, or just clustering?
- Does this change survive more than one data point?
DevOps impact
- More objective postmortems
- Fewer knee-jerk architectural changes
- Better long-term reliability strategies
Statistics helps teams fight recency bias and narrative fallacies.
4. Replacing “Gut Feel” With Hypothesis-Driven Changes
Many DevOps changes sound like this:
“We think this will reduce failures.”
But “thinking” isn’t testing.
Statistical mindset shift
Before making a change, define:
- A hypothesis: “This change will reduce deploy failures by 20%”
- A metric
- A time window
- A baseline
Afterwards, evaluate:
- Did the metric change beyond normal variation?
- Is the effect consistent?
- How confident are we in the result?
DevOps impact
- Fewer opinion-driven debates
- More confidence in architectural decisions
- Easier rollback decisions when changes don’t help
You don’t need perfect experiments just explicit hypotheses.
5. Better Alerting Through Probability
Traditional alerting often relies on static thresholds:
- CPU > 80%
- Error rate > 2%
This creates alert fatigue because systems don’t behave statically.
Statistical mindset shift
Instead of hard thresholds:
- What is normal behavior for this metric?
- How often do values exceed this naturally?
- Is this deviation statistically unusual?
Even simple approaches (rolling averages, standard deviation bands, historical baselines) dramatically reduce noise.
DevOps impact
- Fewer false positives
- Faster response to real incidents
- More trust in alerts
Good alerting is a probability problem, not a configuration problem.
6. Embracing Uncertainty Instead of Hiding It
DevOps culture often rewards confidence:
“This will work.”
“That change caused the outage.”
Statistics teaches a more honest language:
- “There’s a 70% chance…”
- “Based on historical data…”
- “We’re moderately confident…”
Statistical mindset shift
Uncertainty isn’t weakness it’s accuracy.
DevOps impact
- Better risk communication
- Healthier engineering discussions
- Fewer blame-driven decisions
Teams that acknowledge uncertainty make better long-term decisions.
Final Thoughts
Statistical thinking doesn’t slow DevOps down it prevents wasted motion.
You don’t need advanced math, machine learning, or complex models. Just:
- Think in distributions
- Respect variability
- Question small sample sizes
- Treat changes as experiments
DevOps already generates massive amounts of data. Statistics is how you turn that data into judgment, not just dashboards.
If DevOps is about feedback loops, statistics is how you tell signal from noise.
Explore DevOps basics here, then master it with Jeevi’s resources and our complete DevOps training.