
Modern applications built on microservices, containers, and Kubernetes require advanced monitoring solutions. Traditional monitoring tools are no longer sufficient for dynamic cloud environments.
Cloud-native monitoring tools help teams track metrics, logs, traces, and performance across distributed systems.
In this guide, we’ll explore the top monitoring tools for cloud-native applications that DevOps teams use in 2026.
Why Monitoring is Critical for Cloud-Native Applications
Cloud-native architectures introduce challenges such as:
- Dynamic infrastructure
- Microservices complexity
- Distributed tracing
- Container orchestration
Without proper monitoring, it becomes difficult to identify performance bottlenecks.
A modern monitoring solution should provide:
- Real-time metrics
- Distributed tracing
- Log aggregation
- Alerting and dashboards
- Kubernetes observability
1. Prometheus
Best for: Kubernetes monitoring and open-source observability.
Prometheus is one of the most popular cloud-native monitoring tools. It was originally developed at SoundCloud and later joined the Cloud Native Computing Foundation.
Key Features
- Powerful time-series database
- PromQL query language
- Kubernetes integration
- Flexible alerting system
- Open-source ecosystem
Pros
✔ Free and open-source
✔ Strong Kubernetes integration
✔ Large community support
Cons
❌ Limited long-term storage
❌ Requires configuration expertise
2. Grafana
Best for: Visualization and dashboards.
Grafana is widely used for visualizing monitoring data. It integrates seamlessly with Prometheus and other monitoring platforms.
Key Features
- Interactive dashboards
- Multiple data sources
- Real-time alerting
- Plugin ecosystem
Pros
✔ Powerful visual dashboards
✔ Works with many monitoring tools
✔ Highly customizable
Cons
❌ Requires data source integration
❌ Advanced features need configuration
3. Datadog
Best for: Full-stack observability for cloud environments.
Datadog is a SaaS monitoring platform designed for modern cloud-native infrastructure.
Key Features
- Infrastructure monitoring
- Application performance monitoring (APM)
- Log management
- AI-powered alerts
- Cloud provider integrations
Pros
✔ Easy setup
✔ Excellent visualization
✔ All-in-one monitoring platform
Cons
❌ Expensive for large teams
❌ Vendor lock-in risk
4. New Relic
Best for: Application performance monitoring.
New Relic provides deep insights into application performance, making it ideal for microservices architectures.
Key Features
- Distributed tracing
- Real-time metrics
- Error tracking
- Infrastructure monitoring
Pros
✔ Advanced APM capabilities
✔ Developer-friendly interface
✔ Strong analytics tools
Cons
❌ Pricing complexity
❌ Learning curve for beginners
5. Elastic Stack (ELK)
The Elastic Stack combines multiple tools for log monitoring and observability:
- Elasticsearch – Search and analytics engine
- Logstash – Data processing pipeline
- Kibana – Visualization dashboards
Key Features
- Centralized logging
- Real-time log analysis
- Powerful search capabilities
Pros
✔ Strong log analytics
✔ Open-source flexibility
✔ Highly scalable
Cons
❌ Complex setup
❌ High infrastructure usage
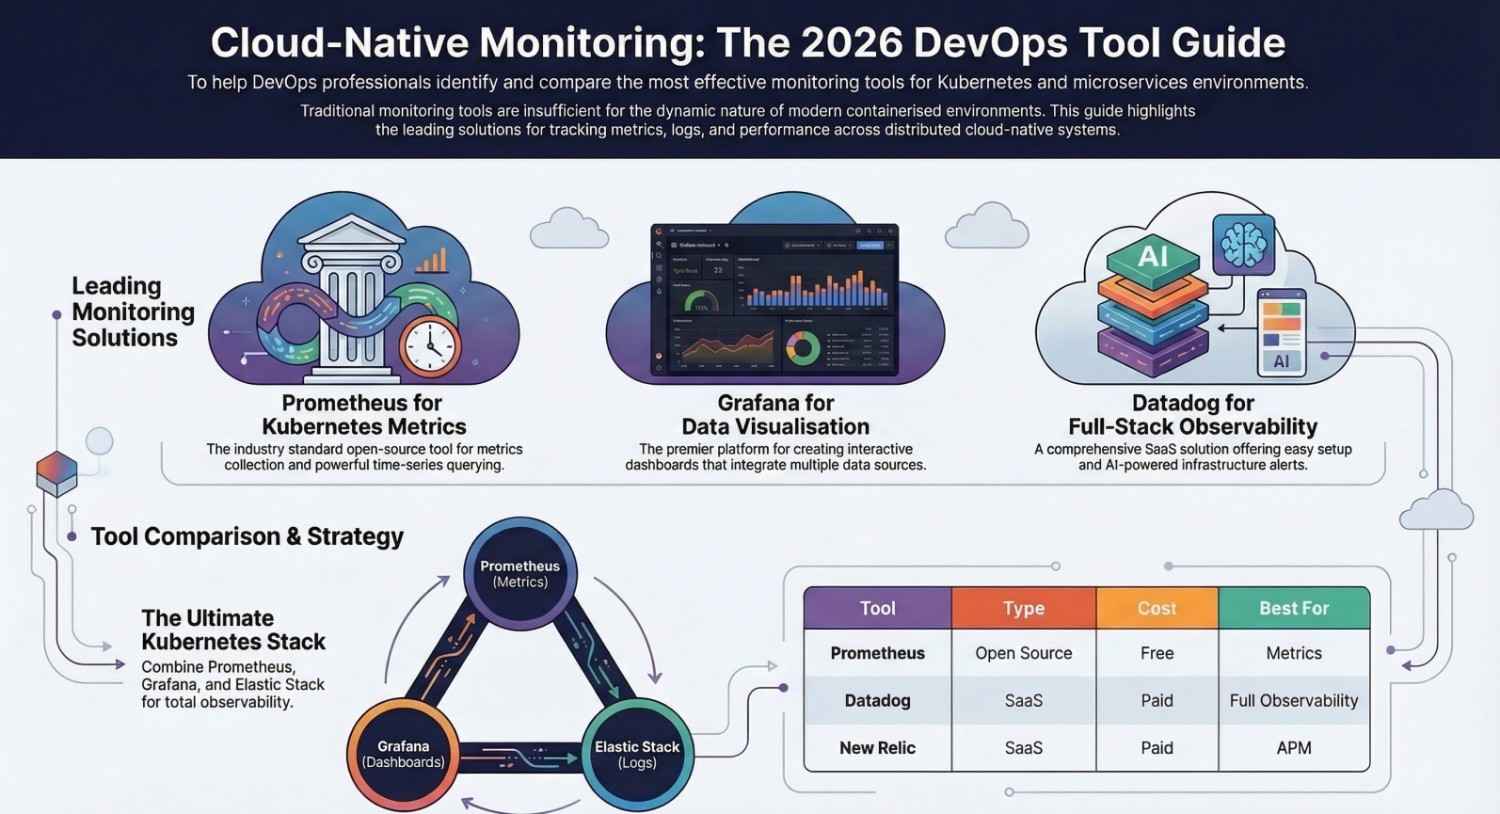
Prometheus vs Datadog vs New Relic
| Feature | Prometheus | Datadog | New Relic |
|---|---|---|---|
| Type | Open source | SaaS | SaaS |
| Kubernetes Support | Excellent | Excellent | Good |
| Cost | Free | Paid | Paid |
| Setup | Complex | Easy | Moderate |
| Best For | Metrics | Full observability | APM |
Best Monitoring Stack for Kubernetes
Many DevOps teams combine multiple tools:
Popular cloud-native monitoring stack
- Prometheus → Metrics collection
- Grafana → Dashboards
- Elastic Stack → Logs
- Jaeger → Distributed tracing
This stack provides complete observability for Kubernetes environments.
How to Choose the Right Monitoring Tool
When selecting a monitoring tool for cloud-native applications, consider:
- Infrastructure complexity
- Kubernetes integration
- Pricing model
- Scalability requirements
- Ease of deployment
Final Thoughts
Monitoring is essential for maintaining high availability and performance in cloud-native applications.
Tools like Prometheus, Grafana, Datadog, New Relic, and Elastic Stack provide powerful observability capabilities for modern DevOps teams.
Choosing the right monitoring stack depends on your infrastructure, team expertise, and scalability needs.
- If you want to explore AWS, start your training here.
- If you want to explore DevOps, start your training here.