Introduction.
In today’s fast-paced software development world, speed and quality are critical. DevOps has emerged as a game-changer by bridging the gap between development and operations. DevOps is more than just a set of practices—it’s a cultural shift.
At the heart of this shift are powerful DevOps tools that streamline workflows. These tools help automate repetitive tasks and increase collaboration. One essential area where DevOps tools shine is DevOps and testing.
Testing is no longer a phase at the end of development. It is now integrated throughout the DevOps lifecycle. DevOps encourages continuous integration and continuous delivery (CI/CD).
Testing is deeply embedded in both of these practices. That’s why DevOps and testing must evolve together. Tools like Jenkins, GitLab, and CircleCI support automated build and test pipelines.
They ensure every code change is tested immediately. This helps detect issues early in the development cycle. Early detection saves time, money, and effort. Other tools like Selenium and Cypress automate UI testing.
They are critical to verifying front-end functionality in DevOps workflows. When combined with CI/CD, these testing tools become even more powerful.
Monitoring and logging tools also support DevOps and testing. Tools like Prometheus, Grafana, and ELK stack offer real-time insights.
These insights are valuable for performance testing and error analysis. Configuration management tools like Ansible and Chef automate infrastructure setup.
This ensures environments are consistent for testing and deployment. Infrastructure as Code (IaC) tools like Terraform also support testable environments. With laC, infrastructure can be version-controlled and tested just like code.
This blurs the line between testing software and testing systems. Security testing is another crucial part of DevOps tools. Tools like SonarQube and OWASP ZAP automate code quality and security checks. Security testing is integrated directly into DevOps pipelines.
This practice is known as DevSecOps—a natural extension of DevOps and testing. Containerization tools like Docker help standardize environments. Kubernetes manages container orchestration at scale.
Testing in containers ensures consistency across development, staging, and production. Containers also make it easier to run tests in parallel. This speeds up the feedback cycle dramatically.
Cloud-based DevOps tools bring scalability to DevOps and testing. Platforms like AWS, Azure, and Google Cloud offer native DevOps services. These services simplify testing in distributed systems.
Code repositories like GitHub and Bitbucket support collaboration. Integrated test tools run validations on every pull request.
This reinforces the idea that testing is a shared responsibility. Quality gates ensure that only code that passes tests is merged. Automation is central to both DevOps and testing. Manual testing can’t keep up with the speed of modern development.
Automated tests can be run on every commit, branch, or deployment. DevOps tools help enforce testing policies without slowing development. Performance testing tools like JMeter assess system behavior under load.
These tools are crucial for identifying bottlenecks before release. Load tests are integrated into pipelines for regular execution.
Test reporting tools present actionable insights to teams. Visual dashboards help monitor test coverage and results.
This transparency enhances collaboration across teams. Collaboration is a core principle of DevOps. And DevOps and testing together strengthen this collaboration.
Agile methodologies are also supported by DevOps tools. Agile emphasizes iterative development and feedback. DevOps tools enable continuous feedback loops through testing. Teams can release faster without compromising quality.
DevOps culture encourages “shifting left” in testing. That means testing starts earlier and happens more frequently. Test automation frameworks support unit, integration, and end-to-end tests.
These layers ensure robust and reliable applications. Testing isn’t just for functionality—it also includes usability and accessibility.
Specialized DevOps tools help automate these testing dimensions. AI and machine learning are the future of DevOps tools. Intelligent testing platforms can predict failures and suggest fixes.
Predictive analysis enhances the synergy between DevOps and testing.
ChatOps is another innovation where bots trigger tests via chat platforms. This makes testing more interactive and accessible to teams. DevOps tools evolve rapidly, and testing tools evolve alongside them. Together, they create a robust software delivery pipeline.
Choosing the right DevOps tools depends on project needs and team expertise. Tool integration is key—isolated tools lead to inefficiencies.
A well-integrated DevOps toolchain accelerates development and testing. It also improves team morale and productivity.
As businesses seek to innovate, DevOps tools are essential enablers. The intersection of DevOps and testing drives digital transformation. It ensures that innovation doesn’t come at the cost of quality.
DevOps tools are the backbone of modern software delivery and their greatest strength lies in how they empower DevOps and testing together.

What Are CI/CD Tools?
The continuous integration/continuous delivery (CI/CD) pipeline is an automated DevOps workflow that streamlines the software delivery process. A vital characteristic of the CI/CD pipeline is the use of automation to help ensure code quality. The CI/CD pipeline is a core practice in DevOps and Agile software development, and it involves two main stages:
- CD (Continuous Delivery or Continuous Deployment)
- CI (Continuous Integration)
CI/CD tools are a set of software tools that automate the processes of Continuous Integration (CI) and Continuous Deployment (CD) in modern software development. These tools help teams automate tasks such as testing, building, and deploying code changes, ensuring faster, more reliable, and consistent software delivery.
In this post, we’ll take a look at some of the most popular tools in the DevOps ecosystem.
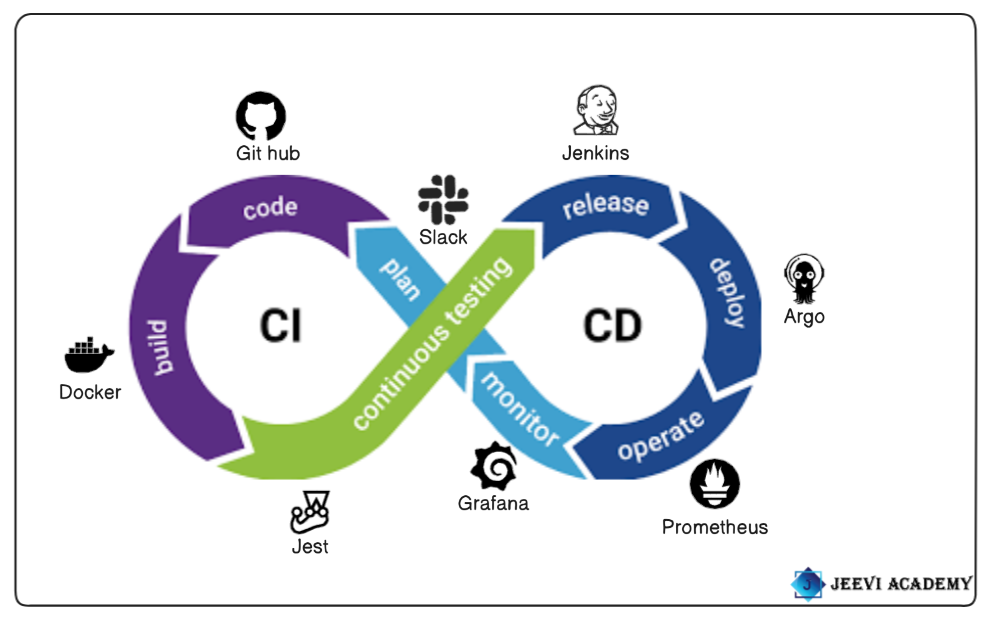
PLAN: In the Plan phase, teams focus on defining project requirements, goals, and strategies for software development. This is the foundation for the entire lifecycle.
CODE: In the Code phase, developers write the application’s source code. This phase emphasizes collaboration, code quality, and version control.
BUILD: In the Build phase, code is compiled, packaged, and transformed into executable artifacts. Automated builds ensure that the process is repeatable and consistent.
TEST: In the Test phase, various types of testing (unit, integration, performance, security) are performed to ensure the quality and reliability of the application.
RELEASE: In the Release phase, the application is prepared for deployment. It involves packaging the application, tagging versions, and generating release notes.
DEPLOY: The Deploy phase involves pushing the application to production or other environments. It focuses on ensuring the deployment process is automated, reliable, and can be rolled back if necessary.
OPERATE: The Operate phase ensures the application runs smoothly in production, with monitoring, alerting, and optimization.
MONITOR: The Monitor phase focuses on continuously tracking system health, performance, and user feedback to ensure the application meets its objectives.
Slack.
Slack, as a collaboration and communication tool, can significantly enhance how teams manage and communicate around planning activities.
Slack is a powerful tool for communication, collaboration, and automation in the DevOps pipeline. Slack provides a single platform for all team members to share information about project updates, bug fixes, and feature enhancements.
It enables teams to make fast decisions and resolve issues efficiently. By simplifying complex workflows, Slack enhances the efficiency and productivity of DevOps teams. SlackOps refers to the practice of utilizing Slack as a communication hub within a DevOps ecosystem.
Slack, with its rich set of features, fosters real-time communication, centralizes information sharing, and promotes cross-team collaboration. The real-time nature of Slack enables quick feedback loops, reducing the lag between identifying issues and resolving them.
Git Hub.
GitHub is a cloud-based platform where you can store, share, and work together with others to write code. GitHub Advanced Security to keep code secure and secrets out of source control. Use code quality integrations to automate code reviews for style, quality, security, and test coverage.
It is one of the most widely used platforms for version control, collaboration, and source code management (SCM) in the software development lifecycle.
It plays a central role in DevOps, supporting teams in managing code, automating workflows, and enabling collaboration between developers, operations teams, and other stakeholders. GitHub fosters collaboration through tools like pull requests, issues, and comments.
This encourages peer reviews, discussions, and feedback, which are crucial in maintaining high code quality in a DevOps environment.
Docker.
Docker is a powerful open-source platform that simplifies application development, deployment, and management by using containerization. At the heart of Docker lies the concept of a Docker container, a lightweight, standalone, and executable software package that includes everything needed to run an application—code, runtime, system tools, libraries, and settings.
Unlike traditional virtual machines, a Docker container shares the host system’s OS kernel, making it more efficient in terms of performance and resource usage.
This allows developers to build once and run anywhere, ensuring consistency across multiple environments—whether it’s development, testing, staging, or production.
A Docker container provides a controlled and isolated environment that encapsulates an application and its dependencies, making it ideal for microservices architecture and distributed systems.
Developers can spin up, scale, and tear down Docker containers in seconds, which accelerates the development lifecycle and simplifies continuous integration and continuous deployment (CI/CD).
This agility also promotes better collaboration between development and operations teams, commonly referred to as DevOps.
To use Docker, one typically starts with a Dockerfile, a simple text file that defines how the Docker container should be built. Once built using the docker build command, the resulting image can be launched as a Docker container.
These containers can be run locally or deployed to production environments in the same state, minimizing bugs caused by environmental differences. Docker Hub, Docker’s public registry, allows users to pull ready-made images or share custom ones, speeding up development workflows.
In real-world applications, a Docker container is often used to run databases, web servers, APIs, and more—all within isolated environments. This isolation ensures that one Docker container doesn’t interfere with another, reducing compatibility issues and improving security.
Docker Compose, another tool in the ecosystem, allows developers to define and run multi-container applications using a single configuration file, orchestrating several Docker containers that work together.
Another benefit of using a Docker container is its portability across cloud platforms and on-premise systems. Whether you’re deploying to AWS, Azure, Google Cloud, or your own data center, a Docker container ensures that your application runs exactly as expected.
Additionally, tools like Kubernetes can manage and orchestrate thousands of Docker containers across a distributed system, providing scalability and fault tolerance.
Docker has revolutionized modern software engineering by making infrastructure more programmable and repeatable.
Each Docker container can be versioned, rolled back, or rebuilt with ease, helping teams maintain control and traceability. Whether you’re developing a simple app or managing complex enterprise workloads, incorporating Docker containers into your workflow can drastically reduce time to market and increase deployment reliability.
Docker container encapsulates the essence of efficiency and consistency in software deployment. It empowers developers to create modular, scalable, and reliable applications with fewer headaches.
As organizations increasingly embrace cloud-native technologies, the importance of understanding and utilizing Docker containers continues to grow. Whether you’re just starting or looking to optimize your CI/CD pipeline, learning how to work with Docker containers is a skill that pays off across the entire software development lifecycle.
Jest.
Jest is a JavaScript testing framework designed to ensure correctness of any JavaScript codebase. primarily used for testing JavaScript code in React, Node.js, and other JavaScript applications.
It is widely used in DevOps pipelines to automate the testing phase, ensuring the reliability and quality of the application. Jest is designed to work out-of-the-box with minimal setup.
This makes it easy to integrate into existing DevOps workflows without much configuration overhead. Jest runs tests in parallel to improve speed, especially for large test suites.
Jest has built-in support for mocking functions and spying on function calls, which is useful in testing complex dependencies and interactions.
Jenkins.
Jenkins is one of the most widely used CI tools in DevOps, renowned for automating various stages of the software development lifecycle, including building, testing, and deploying applications. As a powerful, open-source automation server, Jenkins plays a pivotal role in streamlining DevOps practices, helping teams achieve continuous integration (CI) and continuous delivery (CD).
Among all the CI tools in DevOps, Jenkins stands out due to its flexibility, extensive plugin ecosystem, and active community support. Originally developed in Java, Jenkins can run on various platforms and integrates seamlessly with hundreds of development, testing, and deployment tools, making it a go-to solution for developers and DevOps engineers worldwide.
The core strength of Jenkins lies in its ability to automate repetitive tasks and ensure consistent software delivery. As one of the leading CI tools in DevOps, it allows developers to frequently merge their code into a shared repository where automated builds and tests are triggered.
This ensures that bugs are detected early, code quality remains high, and the integration process becomes smoother and less error-prone. Jenkins can be easily configured to run builds on every code commit, schedule builds periodically, or trigger them based on other custom events, offering ultimate control over the CI/CD pipeline.
When evaluating CI tools in DevOps, Jenkins offers one of the most robust ecosystems. With over 1,800 plugins available, Jenkins can integrate with virtually any technology used in modern software development, including Git, Maven, Docker, Kubernetes, Ansible, and more.
These integrations allow Jenkins to orchestrate complex workflows across distributed systems and cloud environments, turning it into a powerful automation hub. Teams can define their pipeline using either the classic GUI or the more modern “Pipeline as Code” approach using Jenkinsfile, which helps version control the pipeline alongside the application code.
As CI tools in DevOps continue to evolve, Jenkins remains highly relevant due to its adaptability. Whether you’re managing a small project or operating at enterprise scale, Jenkins can be configured to meet your needs. It supports parallel and distributed builds, allowing faster execution of test cases and build jobs across multiple agents. This scalability is essential in DevOps pipelines where speed and efficiency are crucial. Jenkins also supports real-time monitoring, notifications, and detailed logging, helping teams stay on top of build statuses and failures.
Security and access control are other critical areas where Jenkins shines among CI tools in DevOps. Jenkins offers robust user authentication and authorization features, along with the ability to enforce role-based access control (RBAC). This ensures that only authorized team members can access or modify specific parts of the pipeline. Plugins further extend these capabilities, integrating with enterprise-grade authentication systems like LDAP and OAuth.
Another reason Jenkins is a favorite among CI tools in DevOps is its support for containerized environments and cloud-native development. Jenkins can run inside Docker containers and orchestrate builds for applications running in Kubernetes clusters.
This enables developers to build, test, and deploy microservices in isolated and consistent environments, reducing errors caused by differences between local and production systems. Jenkins X, an extension of Jenkins, is designed specifically for Kubernetes-native CI/CD, offering faster pipelines and better cloud integration.
Community support also plays a crucial role in Jenkins’ success as one of the most trusted CI tools in DevOps. With thousands of contributors and frequent updates, Jenkins continues to improve in terms of performance, security, and usability. Whether you’re new to DevOps or an experienced engineer, the Jenkins community provides extensive documentation, tutorials, and forums to help you get the most out of your automation pipelines.
Jenkins has earned its place as one of the most essential CI tools in DevOps, offering flexibility, extensibility, and power to automate every aspect of the software delivery process. It enables development teams to implement CI/CD practices effectively, resulting in faster development cycles, higher code quality, and more reliable software releases. With its broad plugin ecosystem and strong community, Jenkins remains a cornerstone of modern DevOps pipelines. If you’re exploring CI tools in DevOps, Jenkins is a mature, proven, and highly capable solution worth mastering.
Argo.
Argo CD is a declarative, GitOps continuous delivery tool for Kubernetes. It is one of the most widely used tools in DevOps for managing Kubernetes application deployments.
It is a powerful suite of open-source tools that can be highly useful in DevOps, particularly for automating and managing continuous delivery (CD) workflows in Kubernetes environments.
Argo has several projects that play different roles in the DevOps pipeline, but the main ones used for deployment are Argo CD and Argo Workflows.
It is automatically syncs the desired state of applications with the Kubernetes cluster. If a configuration change is detected in Git, Argo CD updates the cluster automatically. It supports deployment to multiple Kubernetes clusters.
Prometheus.
Prometheus is an open-source monitoring and alerting toolkit designed for reliability and scalability, particularly in dynamic cloud-native environments.
Originally developed by SoundCloud in 2012 and later donated to the Cloud Native Computing Foundation (CNCF), Prometheus has become a core component of modern observability stacks. The Prometheus tool is best known for its multidimensional data model, which stores time-series data identified by metric names and key-value pairs called labels. This approach allows users to filter, aggregate, and query metrics with high precision.
One of the defining features of the Prometheus tool is its pull-based data collection model, where it scrapes metrics from targets via HTTP endpoints, rather than relying on those targets to push data.
This makes it especially well-suited for monitoring ephemeral infrastructure like containers and microservices. Prometheus comes with its own powerful query language called PromQL (Prometheus Query Language), enabling complex data analysis, transformations, and alert conditions.
It also includes an embedded time-series database, eliminating the need for external storage backends for most use cases. The Prometheus tool supports integrations with many systems through exporters—components that expose metrics in Prometheus format.
Common exporters include Node Exporter for Linux server metrics, Blackbox Exporter for uptime probing, and custom exporters for databases, applications, and cloud platforms.
Prometheus integrates seamlessly with visualization tools like Grafana, where data from Prometheus can be displayed in dynamic dashboards. Its built-in alertmanager handles notifications based on alert rules defined in PromQL, supporting channels like email, Slack, and PagerDuty.
The Prometheus tool is highly autonomous and resilient; it continues collecting metrics even during network outages or target unavailability. It is widely used in Kubernetes environments due to its ability to automatically discover services and scale dynamically with workloads.
Prometheus adheres to a philosophy of simplicity, reliability, and independence, making it ideal for monitoring microservices, infrastructure, and applications across distributed systems.
Its thriving open-source community ensures continuous improvements, regular updates, and a growing library of exporters and integrations. The Prometheus tool empowers developers and operations teams to proactively detect issues, improve performance, and maintain high availability in complex environments.
Grafana.
Grafana is a powerful open-source analytics and interactive visualization web application widely used for monitoring and observability. Originally developed by Torkel Odegaard in 2014, Grafana has grown into a critical tool for organizations seeking real-time insight into their infrastructure, applications, and services.
Built to work seamlessly with a variety of data sources like Prometheus, InfluxDB, Graphite, Elasticsearch, MySQL, PostgreSQL, and many more, Grafana allows users to create dynamic and highly customizable dashboards that provide a comprehensive view of metrics, logs, and traces.
The Grafana open source edition serves as the foundation of the platform and is completely free to use, offering robust features that cater to both individual developers and large enterprise teams.
One of Grafana’s key strengths is its rich ecosystem of plugins and its user-friendly interface, enabling users to visualize complex data sets through graphs, heatmaps, tables, and alerts with minimal configuration.
Grafana also supports alerting, where users can set thresholds and be notified via channels like Slack, PagerDuty, email, or webhooks when conditions are met.
Another distinguishing feature is its support for data transformations, enabling complex queries and real-time data manipulation without writing code. With the Grafana open source version, users benefit from a wide array of community-contributed dashboards and templates, streamlining the process of setting up monitoring solutions for common tools like Kubernetes, Docker, Linux servers, databases, and cloud services.
Its powerful query editors allow seamless interaction with each data source, preserving the unique capabilities of each system. Grafana is often used in DevOps environments for infrastructure monitoring, application performance management (APM), and business intelligence grafana dashboards.
It can be deployed on-premises or in the cloud and integrates well with modern DevOps stacks. The platform’s scalability ensures that it can support organizations as they grow, from a few metrics to millions.
Security is also a focus in Grafana, with user authentication via LDAP, OAuth, or built-in roles. While Grafana Labs offers an enterprise edition with advanced features like reporting, fine-grained access control, and 24/7 support, the Grafana open source project remains the core and continues to be maintained and improved by a vibrant global community. It is licensed under the AGPLv3 license, which promotes free use and distribution while ensuring modifications remain open to the community.
Grafana is also an integral component of the modern observability stack, often paired with Prometheus and Loki (Grafana’s logging solution), creating a full monitoring suite.

Conclusion.
If you haven’t already embraced the power of DevOps tools, now is the time to start. Experiment with different tools, build your automation pipelines, and see how they transform your development process. The tools you choose will help shape your team’s efficiency, collaboration, and delivery speed. The sooner you start, the sooner you’ll realize the potential for optimizing your workflows.